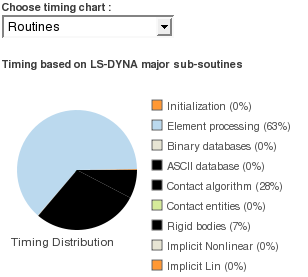
Implemented feature to view timing information. Three types of data can be viewed.
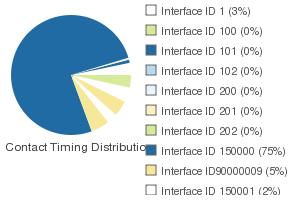
1. Timing distribution based on some major routines in LS-DYNA such as contact, element, etc. AND individual contact based.
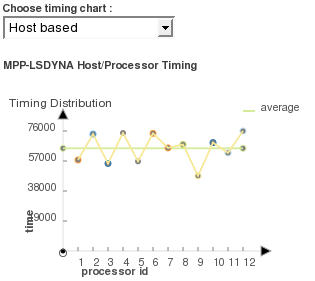
2. When running in distributed environment, you can view the host/processor based timing distribution.
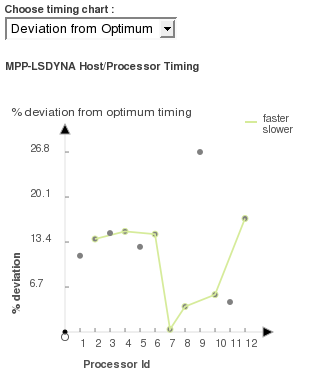
3. Using data available in 2, you can view the deviation of each processor from the average (optimum) timing information. Percentage deviation of each processor from the optimum (average) timing is plotted against each processor/host. The deviation chart is broken down further to faster processors, whose individual timing is lower than the average, and slower processors, whose timing is higher than the average. In the example below, you can see that processor number 7 is performing at optimum level while processor number 9 is the slowest. You can diagnose the problem further by outputting the decomposed model for each processor to look at its contents for performing tuning.
Thanks to Dilip Bhalsod for the suggestion!


