Workflow Provider: Execute Workflows within a Workflow

d3VIEW has a new worker called ‘Workflow Provider’ which allows us to execute other workflows we may have saved on the platform within the current one we are building and executing. This saves us time from rebuilding parts of a workflow that can be taken from an already built one. Find the ‘Workflow Provider’ worker…

October 13, 2022 | by

Text Parameterize GUI: A Workflow Tool to Parameterize Input Files

The new ‘Text Parameterize GUI’ worker helps to create machine generated designs by providing a simple to use interface to parameterize any part of a text file. Examples of such applications include single stage Design of Experiments, Sensitivity Analyses, Multi-stage Optimization and for generic machine learning problems. Locate the ‘Text Parameterize GUI’ worker under the…

October 13, 2022 | by

Using d3VIEW-Workflows to Build and Launch DOE Simulations

Workflows is d3VIEW’s application for streamlining complex business processes. With its capabilities, we can create and employ automated DOE studies for quicker analysis. Using the application’s new shape worker, *TEXT_PARAMETERIZE_GUI, we can set-up custom parameters for our text-based files, generate sampling points from these parameters, create simulations from the text, launch the DOE studies from…

September 15, 2022 | by

Simlytiks Dashboards

d3VIEW’s visualization application Simlytiks® now has a new page layout called Dashboard that allows users to set-up a free-form presentation-styled page using dedicated widgets. Add custom text, images, data filters and aggregators, and Simlytiks charts as well. To better illustrate Simlytiks Dashboard capabilities, we’ll be looking at the Iris Class dataset which looks at how…

September 14, 2022 | by

New Envelope Feature to Aid Material Selection in d3VIEW

d3VIEW supports material calibration and storage of calibrated materials in a scientific database native to d3VIEW. Once materials are stored in the database, d3VIEW supports filters to search and retrieve the materials of choice. Recently, we have been working on supporting visual selection through “Brushing” – a term often used to describe the ability to…

September 7, 2022 | by

Test vs CAE in d3VIEW

As simulations drive a large portion of product development, reliance on test-data at critical development stages is invaluable to further our understanding of reality and assess our simulations. Among a wide variety of tests conducted today, the test-data can be broadly grouped into coupon-based (for material calibration), component based (for sub-system validation) and full-system tests.…

December 3, 2021 | by

Data Drilling in Simlytiks

d3VIEW’s Data Visualization Application, Simlytiks, offers a wide-variety of charts with different options for an enhanced data-mining experience. One of these chart features includes data drilling which involves navigating through multiple dimensions of data. A chart with data-drilling capabilities presents data columns in hierarchical layers allowing us to explore different levels within the same container.…

October 7, 2021 | by

Curve Digitization in d3VIEW

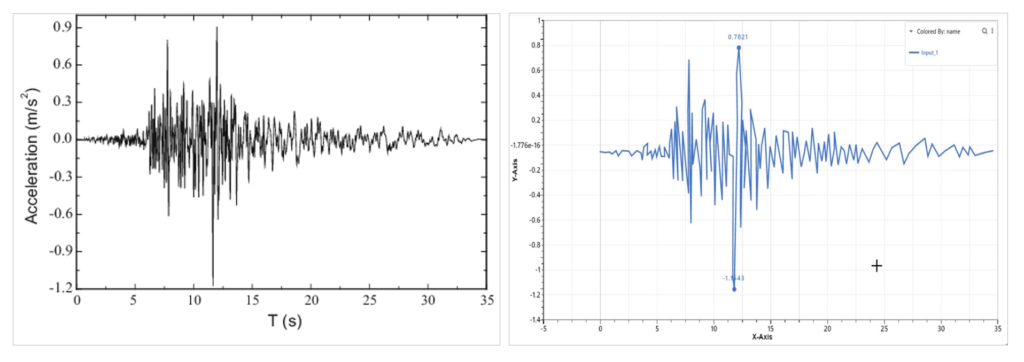
In several instances, time-history curves may need to be imported from either an Image (PNG/JPEG,.) or PDF files for use in comparison with simulations or for material calibration. d3VIEW Workflows now has the ability to digitize these images into a usable data curve. This post reviews the 5-step process in digitizing the image from a…

September 27, 2021 | by